Configure NanoVNA to Display SWR,
Resistance and Reactance
This page explains how to configure a NanoVNA to display SWR, Resistance (R), and Reactance (X) at the same time, how to read those values on the screen, and how to use them together when evaluating an antenna. Before continuing, readers who are new to these measurements should first review the separate pages on Understanding Antenna SWR, Understanding Antenna Resistance, and Understanding Antenna Reactance. Those pages explain what each value means, what affects it, what values are desirable, and how each measurement relates to antenna performance. Once those concepts are familiar, the steps below will show how to display and use all three measurements on the NanoVNA.
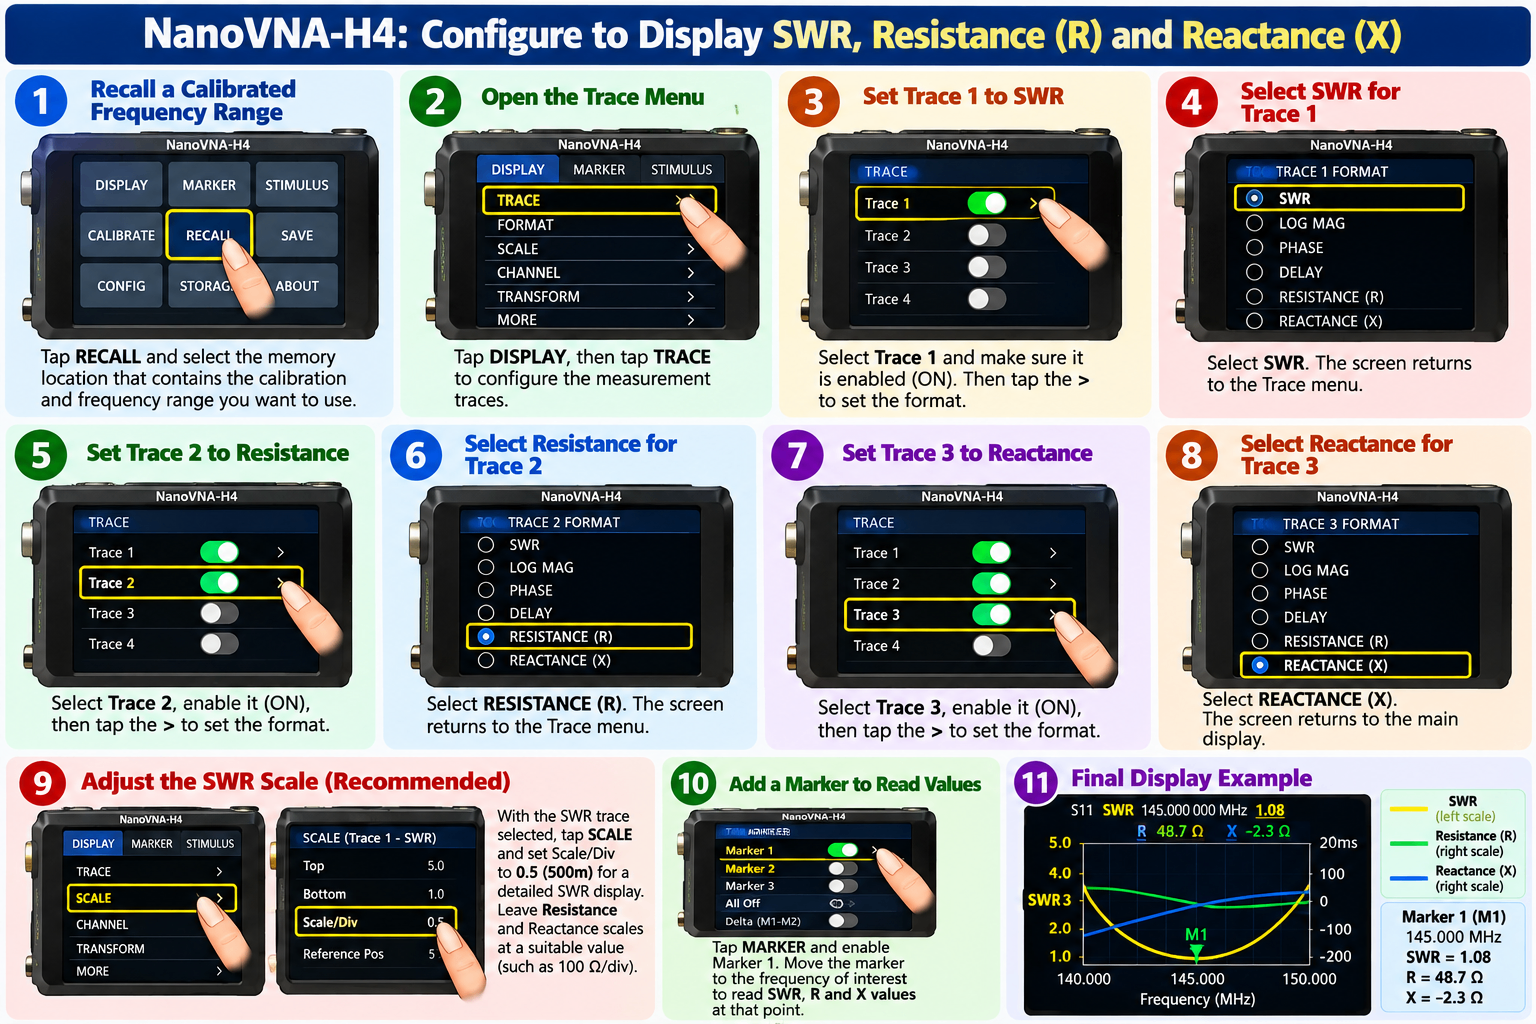
To configure the NanoVNA to display SWR, Resistance (R), and Reactance (X) at the same time, first recall or set the frequency range you want to examine. If you have already calibrated and saved that frequency range in one of the NanoVNA's memory locations, use RECALL and select that saved memory before changing the display. This preserves the calibration and frequency range you already established. Once the desired sweep is displayed, tap DISPLAY, then TRACE. The NanoVNA can display several traces simultaneously, so the goal is to assign one trace to SWR, a second trace to Resistance, and a third trace to Reactance. Select the first trace you want to use, make sure it is enabled, and then select its measurement format as SWR. Return to the TRACE menu, select a second trace, enable it, and set its format to RESISTANCE. Then select a third trace, enable it, and set its format to REACTANCE. The NanoVNA will normally display each trace in a different color so that the three measurements can be distinguished on the screen.
After the three traces are enabled, return to the main measurement screen. You should now see three curves across the sweep: one for SWR, one for Resistance (R), and one for Reactance (X). The scale shown along the side of the display corresponds to whichever trace is currently selected or active. For example, if the SWR trace is selected, the scale will show SWR units; if the Resistance or Reactance trace is selected, the scale will be in ohms. To change which scale is shown, return to DISPLAY → TRACE and select the trace you want to make active. This does not turn the other traces off; it simply determines which trace controls the visible vertical scale.
For SWR, a useful display setting is 0.5 SWR unit per division. With the SWR trace selected, go to DISPLAY → SCALE → SCALE/DIV and set the value to 0.5. On the NanoVNA display this may appear as 500m, meaning 0.500 per division. This scale makes it much easier to see small changes in SWR around the useful operating range of approximately 1.0:1 to 2.0:1. Resistance and Reactance can normally be left at a broader scale, such as 100 ohms per division, unless you have a reason to examine smaller changes more closely.
Next, enable a marker so you can read the exact values at a particular frequency. Open the MARKER menu and turn on a marker, then move it to the frequency you want to examine. At the top of the screen, the NanoVNA will display the values for the enabled traces at that marker frequency. For example, you might see an SWR value of 1.5, a Resistance value of 43 Ω, and a Reactance value of +18 Ω. Together, the resistance and reactance describe the impedance at that frequency as approximately 43 + j18 Ω. If you enable two markers, the NanoVNA can compare two different frequencies, but the limited space at the top of the screen may prevent all three trace readings from being displayed at once. For normal antenna tuning, one marker is often easier to work with.
When interpreting the readings, remember that SWR is the main tuning value, while Resistance and Reactance help explain why the SWR is high or low. In a typical 50-ohm amateur-radio system, an ideal reading would be approximately R = 50 Ω and X = 0 Ω, which corresponds to an impedance near 50 + j0 Ω. Resistance that is substantially above or below 50 ohms contributes to higher SWR. Reactance that is substantially above or below zero also contributes to higher SWR. Positive reactance means the antenna system is inductive, while negative reactance means it is capacitive. Watching how R, X, and SWR change together as the antenna is adjusted provides much more information than watching SWR alone.
If you want this three-trace arrangement to return every time you recall that particular calibrated frequency range, save the updated display configuration back into the same memory location that contains the calibration. After setting the traces, scales, and markers the way you want them, select CALIBRATE → SAVE, then choose the same memory slot you originally recalled. This updates the saved setup with your display preferences while retaining the calibration associated with that memory. You can repeat this procedure for each of your saved frequency ranges so that SWR, Resistance, and Reactance are available whenever you recall them.
Disclaimer: This independent educational material is not affiliated with, sponsored by, or endorsed by the developers, manufacturers, standards organizations, government agencies, or network operators associated with the technologies and services described.